- Chief Editor: Sadaf Zamir Ahmed
- ISSN (Online): 3006-869X
- ISSN (Print): 3006-9475
- DOI: 10.63062/tk
- Frequency: Annual
- Journal Type: Open Access
- Website: https://theknowledge.com.pk/
- Email: editor@theknowledge.com.pk
- Publisher: Modern College of Commerce and Sciences, Rawalpindi, Punjab, Pakistan.
University Teachers ’Attitudes Towards Creativity: A Case Study of the University of Loralai
Abstract: Instructors carry out a crucial role when they foster creativity in both their students and their classes. Therefore, the purpose of this study is to investigate how university professors view innovation. It was the University of Loralai case study. There were twenty-five university teachers (18 men and 07 women) who were selected at random from the University of Loralai in Balochistan. The research design employed in the study was a descriptive survey, with Likert's five-point questionnaire serving as the data-gathering tool. Two sections of the questionnaire were distributed: one for the study and one for the demographics. The study section examined the attitudes of teachers toward creativity, whereas the demographic section contained information about the teachers. Age, gender, religion, place of residence, province, education, and prior teaching experience were among the demographic factors that were measured. The Al-Nouh et al. scale was employed by the current researchers to look at the mean value of the attitudes of university lecturers (2014). Teachers' views about creativity were categorized into three categories for simplicity of analysis: high, medium, and low (Al-Nouh et al., 2014). Results of the current study showed that University of Loralai teachers’ attitudes towards creativity were high because the mean value was 3.82. According to the scale of Al-Nouh. et al. (2014), this mean value, i.e., 3.82, falls in the category of high mean. Thus, overall, the University of Loralai teachers’ attitudes towards creativity were high. It is concluded through this research that University of Loralai teachers had positive attitudes and opinions toward creativity. Implications and recommendations for future researchers have been discussed.
Key Words: University teachers’ Attitudes, Creative Thinking, Creative Practices, and Creativity
Introduction
Study Background
A product that demonstrates uniqueness and worth is considered creative (Craft, Jeffrey & Leibling, 2001). It is the capacity to form novel connections and generate original ideas (Craft et al., 2001). Everyone has this ability to transmit skills (Craft et al., 2001). Speaking about "little c," creativity and the capacity to develop students' creative potential is more prevalent and appropriate in the field of education (Runco, 2007). Learning procedures that are cognizant of creativity enable learners to transcend mere acquisition and concentrate on critical thinking abilities. It is the capacity to see links between seemingly unrelated objects and to form connections between previously unconnected things. It prioritizes comprehension over memory and merely acquiring content, placing the learner at the center of the learning process. The reproductive experience is not the same as the creative learning process. Numerous authors have stressed the value of creativity in education and society. The OECD identified creativity as the foundation of the knowledge society more than ten years ago (OECD, 2000). According to Banaji, Burn, and Buckingham (2006) and Florida (2002), creativity is seen as a resource for social regeneration as well as a method of economic development.
A growing number of policy declarations and educational initiatives have advocated for promoting creativity in education and integrating it into the school curriculum since 1990 (Craft, 2003; Gibson, 2005; Kwang & Smith, 2004; Park, Lee, Oliver & Crammond, 2006). One of the main teaching objectives of the recently updated South Korean National Science Curriculum is to enhance students' ability to solve scientific problems creatively. Science instructors' opinions of creativity and teaching for creativity have rarely been examined despite the significance of creativity in science and science education. Since the teacher plays a crucial role in determining how students learn (Author et al., 2005; Hashweh, 1996; Pajares, 1992), it is imperative to start by gaining an awareness of the ways in which science teachers view creativity in order to foster it in the classroom. Recently, during a professional development program regarding creativity, Park et al. (2006) looked into how South Korean scientific instructors perceived creativity and science teaching. Upon completion of the professional development, it was observed that the teachers exhibited an increasing knowledge that every kid possesses the ability to express creativity, that creativity is transferable, and that science offers a far greater variety of activities that stimulate creativity. It is possible to incorporate creativity and creativity-centered science instruction.
It would be easier for scientific educators to foster creativity if more research was done on teachers' perceptions of it. Conceptions of creativity are a reflection of cultural values, just like any other teacher conceptions (Eisenhart, Shrum, Harding & Cuthbert, 1988), and this is also true of practical curriculum materials and professional development programs. A person's perception of creativity and their capacity to express it may be influenced by their cultural background (Craft, 2003; Csikszentmihalyi, 1999; Lubart, 1990, 1999; Sawyer, 2006; Sternberg, 2007). According to them, creativity needs to be viewed as an essentially ambiguous and open-ended notion (Craft, 2003). Modeling the diverse components' creative cognitive processes has been one method of understanding creativity. Elements include the individual, procedure, press (environment), issue, and product, which have been incorporated into a number of models of the creative process (Rickards, 1999; Sternberg, 2006; Urban, 1995).
2009 was designated as the European Year of Innovation and Creativity. The Ambassadors' Manifesto (EC, 2009) is one of its products, which views innovation as a prerequisite for Europe's leadership. Thus, innovation can guarantee long-term, sustainable economic growth and offer fresh solutions to the present economic problems (Villalba, 2009). According to the Manifesto, investing in knowledge is essential to progress and the growth of creativity (EC, 2009). The proposal from the European Union (2020) suggests emphasizing creativity, innovation, and entrepreneurship in school curricula (EC, 2010a).
Statement of the Problem
Although most instructors agree that creativity is important for children's problem-solving, thinking skills development, and independence, most teachers do not actively promote it. Makel (2009), as cited in Rinkevich (2011), referred to this disparity as a "creativity gap." One possible explanation for this deficiency is that educators have been pressured to "teach to the test," which emphasizes rote memorization and factual knowledge over creativity (Rinkevich, 2011). There has been less focus on teaching students lasting skills like creative thinking and more on getting good grades and passing exams (Cheung, 2012). Additionally, instructors are subject to time constraints because they frequently have a large curriculum that they must complete in a short amount of time (Turner, 2009). Above all, a lot of educators hold the view that young kids are incapable of thinking creatively or critically, which has led them to place more emphasis on memorization than on critical thinking and problem-solving (Torrance, 1983 in do Souza, 2000). To this is added the reality that, due to a lack of training, the majority of teachers are unable to encourage students' creative thinking.
Objectives of the Study
- To know the University of Loralai teacher’s attitude toward creativity.
Research Question of the Study
- What is the University of Loralai teacher’s Attitude towards Creativity?
Significance of the Study
This study clarified the views of university instructors regarding creativity. The subject of many motivations for creativity is also addressed in this study, and it is pertinent to their career as university teachers. It provides an opportunity to contrast teachers' motivations for pursuing a creative profession with the time period in which they began their teaching careers. It makes sense for those who decide to become teachers to ponder and see creativity in the natural world. This study sheds light on the attitudes and ideas of University of Loralai teachers regarding creativity, which may vary as they gain more experience as teachers. In light of the passing of time, it offers a creative job option. This study offers some context to bolster or undermine their shared attitudes and convictions about creativity. The findings of this study have applications for educators, planners, policymakers, and colleges of education. It can support educators in their work and also boost the motivation of in-service teachers, students, and learning outcomes. It's also crucial to comprehend the reasons behind teachers' decision to become teachers (Atkinson, 2006; Krecic & Grmek, 2005; Richardson & Watt, 2006; Saban, 2003).
Delimitations of the Study
This study was delimited to the teachers of the University of Loralai. Further, it was a case study about teachers’ attitudes towards creativity. This study was only delimited to the context of the University of Loralai.
Literature Review
Wallace (1986) expounded on the mechanisms and characteristics of creativity. Wallace (1986) claimed that in order to achieve success, creativity consists of original ideas, feelings, and methods of thinking. It is necessary to understand oneself and provide constructive encouragement to those who are creative. Here, the researcher offers advice to educators on how to run a creative classroom filled with highly creative pupils and creative activities.
The views of educators and learners on creativity, its products, and its significance, as well as the elements influencing creativity in educational platforms, were documented by Diakidoy and Kanari (1999). Forty-nine teachers and students were given questionnaires for this purpose in order to gather information regarding the idea of creativity and the issues associated with it. This study demonstrated how educators and learners view creativity as a broad notion. Their innovative work goes unappreciated and unsupported.
Aljughaiman and Elizabeth (2005) conducted research on the ideas of educators and creative learners regarding creativity. They give questionnaires to teachers in order to gather information about their attitudes, beliefs, and teaching methods. Instructors looked at incorrect conceptions about creativity and found discrepancies with the actions creative students displayed in the classroom. According to this study, teachers assist in creative enrichment. However, there are a lot of misconceptions and cause factors that are expressed in the limited classroom practices.
The teacher's ideas about teaching for creativity and creativity were explained by HONG and KANG (2009). This study looked into science instructors' perceptions of creativity in the classroom. They discovered disparities between American and South Korean educators' ideas of creativity. The outcome demonstrates that every single teacher had constrained ideas about creativity. Instructors in the US stated that emotions and surroundings were beneficial for creativity, but instructors in Korea felt that ethics was the greatest way to judge creativity.
Wolf (2014) provides definitions for creative concepts. In this work, Wolf (2014) provides a psychological explanation of the notion of creativity. Participants questioned which word best summed up the idea of creativity. Forty-two words were chosen, according to the results, to define creativity. This study indicated the ideal course for future research on creativity.
Chan and Yuen (2015) investigated the attitudes and methods Hong Kong instructors of brilliant children used to foster creativity. Fostering creativity in all children in accordance with Hong Kong curriculum rules was their primary goal. After putting the techniques into practice, teachers had a lot of problems. Through their expertise, skilled teachers elevated the level of creativity in gifted education. The purpose of this study was to examine teachers' perceptions of creativity and methods used in the classroom to encourage it.
In 2015, AKKANAT and GOKDERE talked about the perspectives of chemistry professors on creativity. They employed a qualitative research design for this. Thirteen chemistry professors participated in order to gather data through interviews. Results clarified the association between creativity and intellect among chemistry teachers. They believed that while creativity is a skill that can be used to address issues, culture acts as a barrier to it. Additionally, they clarified that educators possess insufficient knowledge regarding how to foster creativity in their students. They also disclosed that chemistry curricula alone were insufficient to foster students' inventiveness.
The goal of secondary school teachers' perspectives of scientific creativity was explained by Ndeke et al. (2016). As a population, all biology teachers in secondary schools participated, and data were gathered using a quantitative study approach. The findings demonstrated that biology instructors possess a high proportion of general creativity and a low proportion of scientific creativity. The results also provided curriculum designers, educators, trainers, and policymakers with useful knowledge. In order to do this, science teachers' education programs are set up to foster creativity, and curriculum developers create curricula that include educational activities that inspire students' scientific creativity.
Bolden et al. (2010) explained how pre-service primary teachers conceptualized mathematical creativity. Interviews and a questionnaire were used to gather the data. The notion of pre-service teachers was found to be restricted, but it was prevalent when it came to the usage of resources and technology. Pre-service instructors lack the necessary expertise to foster innovation in their teaching methods.
Al-Nouh et al. (2014) investigated basic EFL instructors' perspectives on creativity. They look at the innovative ideas and perspectives of EFL teachers regarding what goes on in the classroom. Participants came from various zones and were chosen at random. A descriptive research approach was adopted for the study. A questionnaire on a five-point Likert scale was used to collect the data. The findings indicated that there were significant disparities in teachers' attitudes regarding age, experience, and in-service training.
Methodology
Research Design
The research design used in this study was quantitative. This kind of research design aims to reach the study's purpose using a quantitative approach using the Al-Nouh et al. (2014) chosen questionnaire.
Population
The study's population consisted of all instructors at the University of Loralai. A random sampling technique was used to take a sample from this population. Below is a detailed description of the sample.
Sampling
Twenty-five instructors from the University of Loralai, representing the departments of education, English, Pashto, Management Sciences, Commerce, Math, and Zoology, made up the study's sample (18 men and seven women). The random sampling approach was used to choose the aforementioned sample.
Research Tool- An Adopted Questionnaire
In this study, the researcher employed a questionnaire as a research instrument. There were two main sections to the questionnaire. The purpose of the first section of the questionnaire was to gather information about the participants' age, gender, place of residence, education, and experience as teachers. The second section, which had 19 statements, was designed to find out how teachers felt about creativity. The questionnaire's items were written on a five-point Likert scale. The scale used was: strongly disagree = 1, disagree = 2, neutral = 3, agree = 4, and strongly agree = 5 for questions 1 through 19.
Data Collection and Data Analysis
Twenty-five teachers—seven female and eight male—who were randomly selected from Loralai University participated. Twenty-five teachers in all submitted their filled-out questionnaires. Of the responders, 70% were between the ages of 35 and 40, while only 10% were older than 40. Given that nearly all teachers (N = 4) possess a Ph.D., this variable was excluded from the analysis. The study participants' demographic features are indicative of University of Loralai teachers. Because this research was only at the B.Ed. Level, the data was analyzed using just basic descriptive statistics, such as percentage, frequency, and mean. However, SPSS Version 20 was used for the whole data analysis process, even for these straightforward descriptive statistics. The present researcher received training from the supervisor on how to use and run the SPSS software. The primary statistical procedure used to compute and evaluate the attitudes of the University of Loralai instructors toward creativity was mean.
Al-Nouh et al. (2014) state that in order to facilitate analysis, the attitudes of the respondents were categorized into three categories: high mean, medium mean, and low mean. The following was the estimated mean as a result:
- (From 1-2.33) shows a low value of mean
- (From 2.34-3.66) shows a medium value of mean
- (From 3.67-5.00) shows a high value of mean
The study's overall design was quantitative in nature. The study comprised 25 teachers from the University of Loralai in Balochistan, Pakistan (18 males and seven females). An adapted version of Al-Nouh et al.'s (2014) questionnaire served as the research tool. Expert evaluations were obtained for the questionnaire's face and content validity. Cronbach Alpha was computed for the research questionnaire's reliability using SPSS version 20.0. The percentage, frequency, and mean are examples of basic descriptive statistics that were used to assess the data collected via a questionnaire. The researcher used a questionnaire titled "University Teachers’ attitude towards creativity," which was developed by previous study experts (Al-Nouh et al., 2014). The questionnaire's items were divided into two groups, referred to as the questionnaire component and the demographic section. In accordance with the advice of the research professionals, the questionnaire's items were left exactly as written to standardize and clarify their meaning. Therefore, a 19-item instrument was prepared for the research. The aforementioned survey used a five-point Likert scale. The five-point Likert scale has labels for Strongly Disagree (SD) and Strongly Agree (SA), ranging from 1 to 5. There were two sections to the instrument. The sample's demographic data was covered in the first section. The respondent provided answers to questions regarding their area, teaching experience, qualification, gender, age, and religion in this section. Nineteen pieces in the instrument's second section represented the teacher's perspective on creativity. Five were designated as "Strongly Agree," four as "Agree," three as "Neutral," two as "Disagree," and one as "Strongly Disagree" on the grading system.
Results
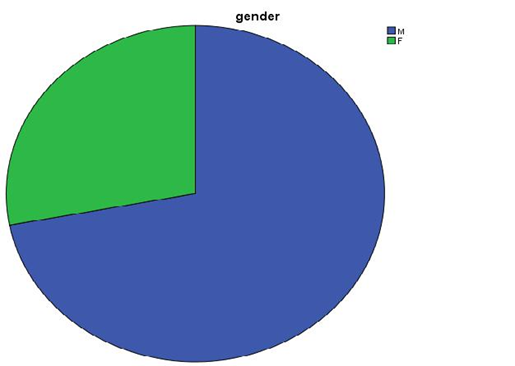
The result regarding gender is tabulated in Table 1. Table 1 below shows that there were 18 male teachers and seven female teachers who expressed their attitudes towards creativity. The frequency of the male teachers was 18, while the frequency of the female teachers was 7. Further, the percentage of male teachers was 72%, while the percentage of female teachers was 28%. The whole description is shown in table 1 below.
Table 1
Teachers’ description regarding gender
Gender
|
|
|
Frequency |
Percent |
Valid Percent |
Cumulative Percent |
|
|
M |
18 |
72.0 |
72.0 |
72.0 |
|
Valid |
F |
7 |
28.0 |
28.0 |
100.0 |
|
|
Total |
25 |
100.0 |
100.0 |
|
Similarly, the teacher’s description is shown in the pie chart. The pie chart below shows that gender-wise, the total number of male teachers was greater than the total number of female teachers. The blue color in the pie chart shows the male teachers, while the green color in the pie chart shows the female teachers.
Pie Chart 1
Teachers’ description regarding gender
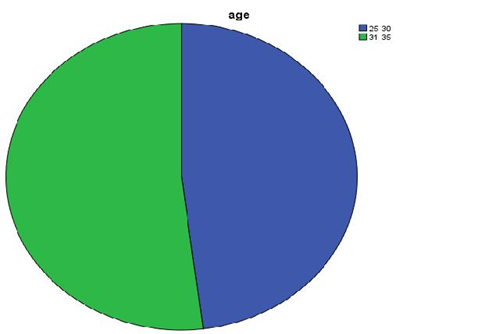
The results regarding age are tabulated in Table 2. Table 2 below shows that age-wise, there were 12 teachers who were in between (25-30 years) while 13 teachers (31-35 years) expressed their attitudes towards creativity. The frequency of (25-30 years) teachers was 12, while the frequency of (31-35 years) teachers was 13. Further, the percentage of the (25-30 years) teachers was 48%, while the percentage of the (31-35 years) teachers was 52%. The whole description is shown in table 2 below.
Table 2
Teachers’ description regarding age
Age
|
|
|
Frequency |
Percent |
Valid Percent |
Cumulative Percent |
|
|
25-30 |
12 |
48.0 |
48.0 |
48.0 |
|
Valid |
31-35 |
13 |
52.0 |
52.0 |
100.0 |
|
|
Total |
25 |
100.0 |
100.0 |
|
Similarly, the age description is shown in the pie chart. The pie chart below shows the age of each. The blue color in the pie chart shows the (25-30 years) age while the green color in the pie chart shows the (31-35 years) age.
Pie Chart 2
Teachers’ description regarding age
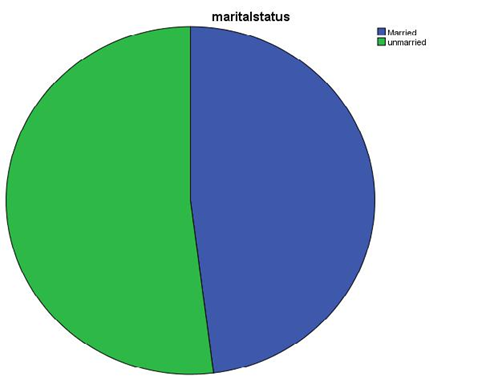
The result regarding marital status is tabulated in Table 3. Table 3 below shows the marital status of those who expressed their attitudes towards creativity. The frequency of the married ones was 12, while the frequency of the unmarried ones was 13. Further, the percentage of the married ones was 48% while the percentage of the unmarried ones was 52%. The whole description is shown in Table 3 below.
Table 3
Teachers’ description regarding marital status
Marital Status
|
|
|
Frequency |
Percent |
Valid Percent |
Cumulative Percent |
|
|
Married |
12 |
48.0 |
48.0 |
48.0 |
|
Valid |
Unmarried |
13 |
52.0 |
52.0 |
100.0 |
|
|
Total |
25 |
100.0 |
100.0 |
|
Similarly, the description of the teachers' marital status is also shown in the pie chart. The pie chart three below shows that marital status-wise, the total number of unmarried ones was greater than the total number of married ones. The blue color in the pie chart shows the married ones while the green color in the pie chart shows the unmarried ones.
Pie Chart 3
Teachers’ description regarding marital status
The result regarding religion is tabulated in Table 4. Table 4 below shows religion-wise teachers who expressed their attitudes towards creativity. The frequency was 25. Further, the percentage was 100%. The whole description is shown in table 4 below.
Table 4
Teachers’ description regarding religion
Religion
|
|
|
Frequency |
Percent |
Valid Percent |
Cumulative Percent |
|
Valid |
Muslims only |
25 |
100.0 |
100.0 |
100.0 |
Similarly, the teacher's religious description is also shown by the pie chart. The blue color in the pie chart shows the religion.
Pie Chart 4
Teachers’ Description Regarding Religion
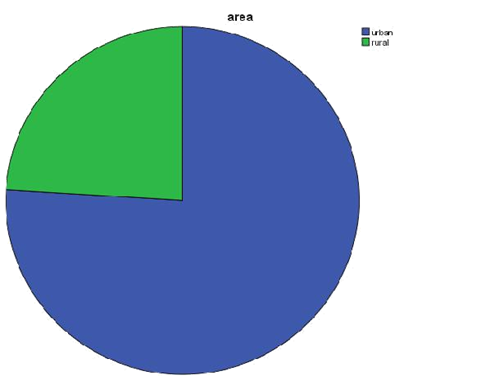
The result regarding area has been tabulated in the following table 5. Table 5 below shows that teachers area-wise expressed their attitudes toward creativity. The frequency of the urban area was 19, while the frequency of the rural area was 6. Further, the percentage of the urban area was 76%, while the percentage of the rural area was 24%. The whole description is shown in Table 5 below.
Table 5
Teachers’ description regarding the area
Area
|
|
|
Frequency |
Percent |
Valid Percent |
Cumulative Percent |
|
|
urban |
19 |
76.0 |
76.0 |
76.0 |
|
Valid |
rural |
6 |
24.0 |
24.0 |
100.0 |
|
|
Total |
25 |
100.0 |
100.0 |
|
Similarly, the area where teachers live is also shown by the pie chart. The blue color in the pie chart shows the urban area, while the green color in the pie chart shows the rural area.
Pie Chart 5
Teachers’ description regarding Area
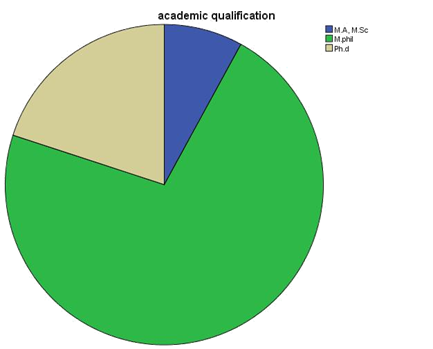
The result regarding academic qualification is tabulated in Table 6. The frequency of (M. Phil) holders was 18. And the frequency of (Ph.D.) holders was 5. Further, the percentage of the (M. A/M.Sc.) was 8.0% while the percentage of the (M. Phil) holders was 72% and the percentage of the (Ph.D.) holders was 20%. The whole description is shown in table 6 below.
Table 6
The teachers’ description regarding academic qualification
Academic Qualification
|
|
Frequency |
Percent |
Valid Percent |
Cumulative Percent |
|
M.A, M.Sc |
2 |
8.0 |
8.0 |
8.0 |
|
M.Phil |
18 |
72.0 |
72.0 |
80.0 |
|
Valid |
|
|
|
|
|
Ph.D |
5 |
20.0 |
20.0 |
100.0 |
|
Total |
25 |
100.0 |
100.0 |
|
Similarly, the teachers’ academic qualifications are described in the pie chart. The blue color in the pie chart shows the (M.A. and M.Sc) holders, while the green color in the pie chart shows the (MPhil) holders and the pink color in the pie chart shows the (Ph.D.) holders.
Pie Chart 6
Teachers’ description regarding academic qualification
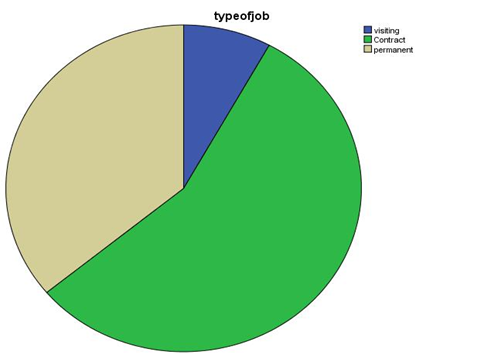
The result regarding the type of job is tabulated in Table 7. The frequency of visiting was two while the frequency of contract was 14 and the frequency of permanent was 9. Further, the percentage of visits was 8.0% while the percentage of contracts was 56%, and the percentage of permanent was 36%. The whole description is shown in table 7 below.
Table 7
Teachers’ description regarding the type of job
Type of job
|
|
Frequency |
Percent |
Valid Percent |
Cumulative Percent |
|
Visiting |
2 |
8.0 |
8.0 |
8.0 |
|
Contract |
14 |
56.0 |
56.0 |
64.0 |
|
Valid |
|
|
|
|
|
Permanent |
9 |
36.0 |
36.0 |
100.0 |
|
Total |
25 |
100.0 |
100.0 |
|
Similarly, the teacher's type of job description is also shown in the pie chart. The blue color in the pie chart shows the visiting while the green color in the pie chart shows the contract and the pink color in the pie chart shows the permanent ones.
Pie Chart 7
Teachers’ description regarding the type of job
The result regarding teaching experience is tabulated in Table 8. The frequency of (5-10) years was 19 while the frequency of (11-15) years was four, and the frequency of the (16-20) years was 2. Further, the percentage of the (5-10) years was 76%, while the percentage of the (11-15) years was 16%, and the percentage of the (16-20) years was 8%. The whole discussion is shown in Table 8 below.
Table 8
Teachers’ description of teaching experience
Teaching Experience
|
|
Frequency |
Percent |
Valid Percent |
Cumulative Percent |
|
5-10 |
19 |
76.0 |
76.0 |
76.0 |
|
11-15 |
4 |
16.0 |
16.0 |
92.0 |
|
Valid |
|
|
|
|
|
16-20 |
2 |
8.0 |
8.0 |
100.0 |
|
Total |
25 |
100.0 |
100.0 |
|
Similarly, the teacher's teaching experience description is also shown in the pie chart. The blue color in the pie chart shows the (5-10) years while the green color in the pie chart shows the (11-15) years, and the pink color in the pie chart shows the (16-20) years.
Similarly, the teacher's province description is shown in the pie chart. The blue color in the pie chart shows Balochistan, while the green color in the pie chart shows Sindh, the pink color in the pie chart shows Punjab, and the purple color in the pie chart shows KPK.
Mean Results of Study
The following table 10 shows that the mean value is 3.8. According to the scale of Al-Nouh. et al. (2014), this mean value (3.8) falls in the category of high mean, which means that the University of Loralai teachers had positive attitudes and beliefs about creativity.
Table 9
Mean results of the study
|
|
N |
Minimum |
Maximum |
Sum |
Mean |
Std. Deviation |
|
attitude towards creativity |
25 |
2.37 |
4.84 |
95.58 |
3.8232 |
.56254 |
|
Valid N (listwise) |
25 |
|
|
|
|
|
Discussion
Soh (2000) asserts that educators play a crucial part in encouraging and supporting students' creativity. Teachers often have positive attitudes and high perceptions of creative thinking practices, as this study shows. Teachers did, however, identify a few obstacles to the effective implementation of creative thinking in their classes, including time restraints and a lengthy curriculum. According to Csikszentmihalyi (1996 in Grainger & Barnes, 2006), students' willingness to think creatively would vanish if they were not allowed to ask questions and experiment with the world around them. The study's primary conclusion is that instructors with less experience and younger backgrounds were more driven to encourage original thought. This aligns with findings from earlier investigations (Cachia & Ferrari, 2010). In a similar vein, people who had only completed primary school expressed greater positivity toward creative thinking than people who had completed middle or high school. Furthermore, according to question 40, the biggest barrier is time, which is followed by a lack of training programs, conventional teaching techniques, conventional written examinations, and a shortage of resources. On the other hand, according to question 41, 63.1% of the teachers said they incorporate creative activities into their sessions.
The interview also showed that teachers criticized the lengthy curriculum and time restrictions, while principals frequently accused teachers of inhibiting students' creative thinking. On the other hand, everyone concurred that parents' cooperation, resource allocation, and in-service training were essential. This study's primary weakness is that it relies mostly on self-reports for data collection. While utilizing a classroom observation would increase the reliability of the results, questionnaires are more practical for gathering data on attitudes and perceptions and may quickly gather data from a large number of people. Notwithstanding this drawback, the survey has provided some information regarding the attitudes and views of educators regarding the practice of creative thinking. Several suggestions come to light. For instance, teacher educators can use the reports of their teachers to organize a course on creativity that includes follow-up observations to meet the professional needs of teachers. Teachers may respect the idea of change, but they may not know how to put it into practice, according to Fullan (2001). Assigning assistant instructors would be another recommendation to allow classroom teachers more time to create innovative activities. It is hoped that the worries expressed by teachers will be given due consideration and that prompt action will be taken to open doors for their professional growth.
Conclusion
According to the results, there were seven female teachers and eight male teachers. Twelve of the professors were between the ages of 25 and 30, and thirteen were between the ages of 31 and 35. In terms of marital status, there were 12 married people and 13 single people per 1,000 people. With regard to religion, the frequency was 25, indicating that all teachers were Muslims. In terms of area, the frequency of the urban area was 19, and the rural area was 6. In terms of academic credentials, there were two people holding M.A./M.Sc. Degrees, compared to eighteen holding M. Phil degrees. Additionally, there were five Ph.D. holders in total. In terms of employment type, there were two visiting teachers for every fourteen contract teachers and nine permanent instructors. In terms of years spent teaching, there were 19 years in the (5–10) year range, four years in the (11–15) year range, and two years in the (16–20) year range. In terms of province, Balochistan had a frequency of 20, Sindh had a frequency of 3, Punjab had a frequency of 1, and KPK had a frequency of 1. This mean value (3.8) falls into the high mean group on the Al-Nouh et al. (2014) scale, indicating that the University of Loralai teachers had favorable attitudes and beliefs regarding creativity.
References
Akkanat, Ç., & Gökdere, M. (2015). Chemistry Teachers’ Views of Creativity. Asia-Pacific Forum on Science Learning and Teaching, 16(1), 1–21. https://www.eduhk.hk/apfslt/download/v16_issue1_files/gokdere.pdf
ALJUGHAIMAN, A., & MOWRER-REYNOLDS, E. (2005). Teachers' conceptions of creativity and creative students. The Journal of Creative Behavior, 39(1), 17-34. https://doi.org/10.1002/j.2162-6057.2005.tb01247.x
Al-Nouh, N. A., Abdul-Kareem, M. M., & Taqi, H. A. (2014). Primary school EFL teachers’ attitudes towards creativity and their perceptions of practice. English Language Teaching, 7(9), 74-90. https://doi.org/10.5539/elt.v7n9p74
Banaji, S., Burn, A., & Buckingham, D. (2006). Rhetoric of creativity: a review of the literature. http://eprints.lse.ac.uk/id/eprint/27114
Bolden, D. S., Harries, T. V., & Newton, D. P. (2009). Pre-service primary teachers’ conceptions of creativity in mathematics. Educational Studies in Mathematics, 73(2), 143-157. https://doi.org/10.1007/s10649-009-9207-z
Chan, S., & Yuen, M. (2013). Teachers’ beliefs and practices for nurturing creativity in students. Gifted Education International, 31(3), 200-213. https://doi.org/10.1177/0261429413511884
Craft, A., Jeffrey, B., & Liebling, M. (2001). Creativity in education. London: Continuum.
Craft, A. (2003). The limits to creativity in education: Dilemmas for the educator. British Journal of Educational Studies, 51(2), 113-127. https://doi.org/10.1111/1467-8527.t01-1-00229
Diakidoy, I. N., & Kanari, E. (1999). Student teachers’ beliefs about creativity. British Educational Research Journal, 25(2), 225-243. https://doi.org/10.1080/0141192990250206
EC (2009). European Ambassadors Manifesto.
EC (2010a). Europe 2020. A strategy for smart, sustainable and inclusive growth.
Eisenhart, M. A., Shrum, J. L., Harding, J. R., & Cuthbert, A. M. (1988). Teacher beliefs. Educational Policy, 2(1), 51-70. https://doi.org/10.1177/0895904888002001004
Gibson, H. (2005). What creativity isn't: The presumptions of instrumental and individual justifications for creativity in education. British Journal of Educational Studies, 53(2), 148-167. https://doi.org/10.1111/j.1467-8527.2005.00288.x
Hashweh, M. Z. (1996). Effects of science teachers' epistemological beliefs in teaching. Journal of Research in Science Teaching, 33(1), 47-63. https://doi.org/10.1002/(sici)1098-2736(199601)33:1<47::aid-tea3>3.0.co;2-p
Hong, M., & Kang, N. (2009). South Korean and the us secondary school science teachers’ conceptions of creativity and teaching for creativity. International Journal of Science and Mathematics Education, 8(5), 821-843. https://doi.org/10.1007/s10763-009-9188-5
Kwang, N. A., & Smith, I. (2004). The paradox of promoting creativity in the Asian classroom: An empirical investigation. Genetic, Social, and General Psychology Monographs, 130(4), 307-332. https://doi.org/10.3200/mono.130.4.307-332
Ndeke, G. C., Okere, M. I., & Keraro, F. N. (2015). Secondary school biology teachers’ perceptions of scientific creativity. Journal of Education and Learning, 5(1), 31. https://doi.org/10.5539/jel.v5n1p31
OECD (2000). Knowledge management in the learning society. Paris.
Pajares, M. F. (1992). Teachers’ beliefs and educational research: Cleaning up a messy construct. Review of Educational Research, 62(3), 307-332. https://doi.org/10.3102/00346543062003307
Park, S., Lee, S., Oliver, J. S., & Cramond, B. (2006). Changes in Korean science teachers' perceptions of creativity and science teaching after participating in an overseas professional development program. Journal of Science Teacher Education, 17(1), 37-64. https://doi.org/10.1007/s10972-006-9009-4
Runco, M. A. (2007). Creativity: theories and themes: research, development, and practice. Amsterdam; London: Elsevier Academic Press.
Villalba, E. (Ed.). (2009). Measuring Creativity. Luxembourg: Publications Office of the European Union.
Wallace, B. (1986). Creativity: Some definitions: the creative personality; The creative process; the creative classroom. Gifted Education International, 4(2), 68-73. https://doi.org/10.1177/026142948600400202
Wolf, R. A. (2014). Defining the concept of creativity (Master's thesis, University of Twente).